All templates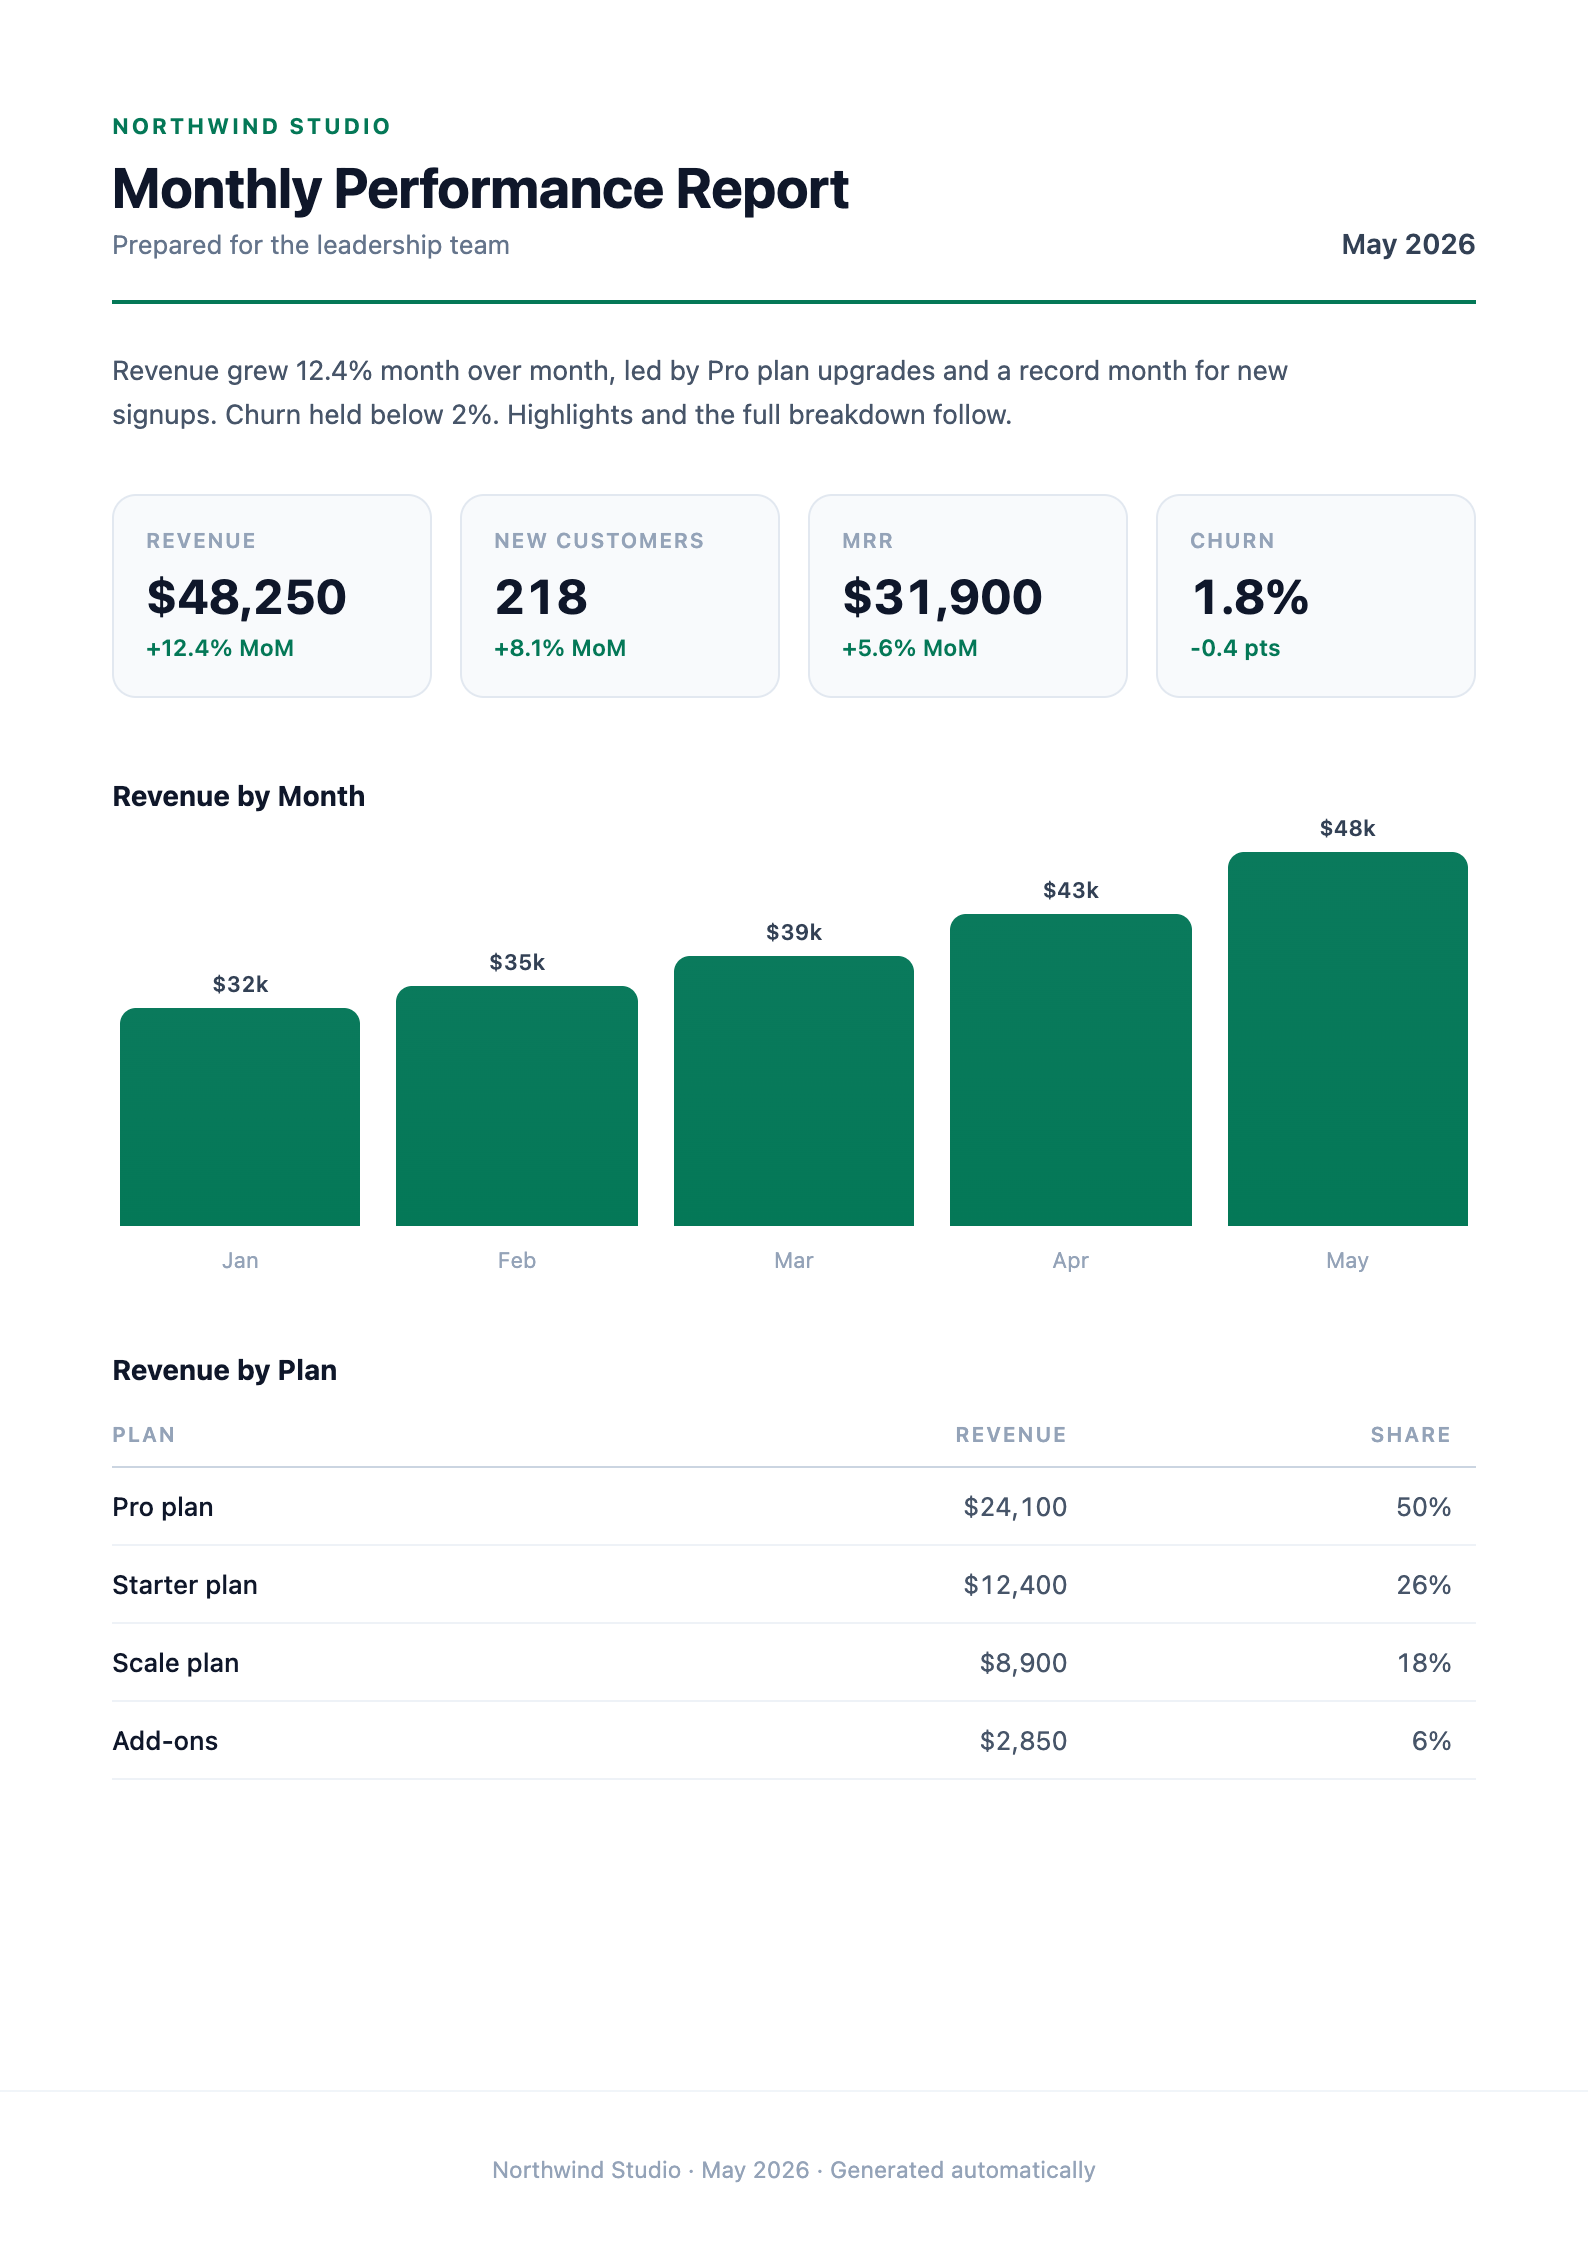
Business report template
A4 portraitAn A4 business report with KPI stat cards, a bar chart, and a breakdown table, all rendered in pure CSS (no images or scripts). Point a weekly cron at the API and the report writes itself.
The exact PDF the API produces. What you preview is what you generate.
Generate with the API
Use this template, publish it to get a template id, then call the API with your data. Replace YOUR_TEMPLATE_ID and YOUR_API_KEY with your own.
import { writeFile } from "node:fs/promises";
import { PdfGlyph } from "pdfglyph";

const client = new PdfGlyph({
  apiKey: "YOUR_API_KEY",
  baseUrl: "https://api.pdfglyph.dev",
});

const { pdf } = await client.generate({
  templateId: "YOUR_TEMPLATE_ID",
  data: {
    "reportTitle": "Monthly Performance Report",
    "periodLabel": "May 2026",
    "organizationName": "Northwind Studio",
    "summary": "Revenue grew 12.4% month over month, led by Pro plan upgrades and a record month for new signups. Churn held below 2%. Highlights and the full breakdown follow.",
    "metrics": [
      {
        "label": "Revenue",
        "value": "$48,250",
        "change": "+12.4% MoM"
      },
      {
        "label": "New Customers",
        "value": "218",
        "change": "+8.1% MoM"
      },
      {
        "label": "MRR",
        "value": "$31,900",
        "change": "+5.6% MoM"
      },
      {
        "label": "Churn",
        "value": "1.8%",
        "change": "-0.4 pts"
      }
    ],
    "bars": [
      {
        "label": "Jan",
        "amount": "$32k",
        "pct": "58"
      },
      {
        "label": "Feb",
        "amount": "$35k",
        "pct": "64"
      },
      {
        "label": "Mar",
        "amount": "$39k",
        "pct": "72"
      },
      {
        "label": "Apr",
        "amount": "$43k",
        "pct": "83"
      },
      {
        "label": "May",
        "amount": "$48k",
        "pct": "100"
      }
    ],
    "rows": [
      {
        "name": "Pro plan",
        "value": "$24,100",
        "share": "50%"
      },
      {
        "name": "Starter plan",
        "value": "$12,400",
        "share": "26%"
      },
      {
        "name": "Scale plan",
        "value": "$8,900",
        "share": "18%"
      },
      {
        "name": "Add-ons",
        "value": "$2,850",
        "share": "6%"
      }
    ]
  },
});

// pdf is a Uint8Array — write it to a file, return it, or stream it.
await writeFile("document.pdf", pdf);
Sample data
The JSON this preview was rendered from. Match these fields, or edit the template to fit the data you already have.
{
  "reportTitle": "Monthly Performance Report",
  "periodLabel": "May 2026",
  "organizationName": "Northwind Studio",
  "summary": "Revenue grew 12.4% month over month, led by Pro plan upgrades and a record month for new signups. Churn held below 2%. Highlights and the full breakdown follow.",
  "metrics": [
    {
      "label": "Revenue",
      "value": "$48,250",
      "change": "+12.4% MoM"
    },
    {
      "label": "New Customers",
      "value": "218",
      "change": "+8.1% MoM"
    },
    {
      "label": "MRR",
      "value": "$31,900",
      "change": "+5.6% MoM"
    },
    {
      "label": "Churn",
      "value": "1.8%",
      "change": "-0.4 pts"
    }
  ],
  "bars": [
    {
      "label": "Jan",
      "amount": "$32k",
      "pct": "58"
    },
    {
      "label": "Feb",
      "amount": "$35k",
      "pct": "64"
    },
    {
      "label": "Mar",
      "amount": "$39k",
      "pct": "72"
    },
    {
      "label": "Apr",
      "amount": "$43k",
      "pct": "83"
    },
    {
      "label": "May",
      "amount": "$48k",
      "pct": "100"
    }
  ],
  "rows": [
    {
      "name": "Pro plan",
      "value": "$24,100",
      "share": "50%"
    },
    {
      "name": "Starter plan",
      "value": "$12,400",
      "share": "26%"
    },
    {
      "name": "Scale plan",
      "value": "$8,900",
      "share": "18%"
    },
    {
      "name": "Add-ons",
      "value": "$2,850",
      "share": "6%"
    }
  ]
}
Start from the Business report template
Open it in the editor as a new draft, adjust the HTML until it looks like yours, then generate PDFs from your code.